Accountability process measure. An accountability process measure is a quality measure that meets four criteria designed to identify measures that produce the greatest positive impact on patient outcomes when hospitals demonstrate improvement. The four criteria are: research, proximity, accuracy and adverse effects (see Understanding the Quality of Care Measures section for an explanation of the criteria). Accountability measures are a subset of core measures (see core measure).
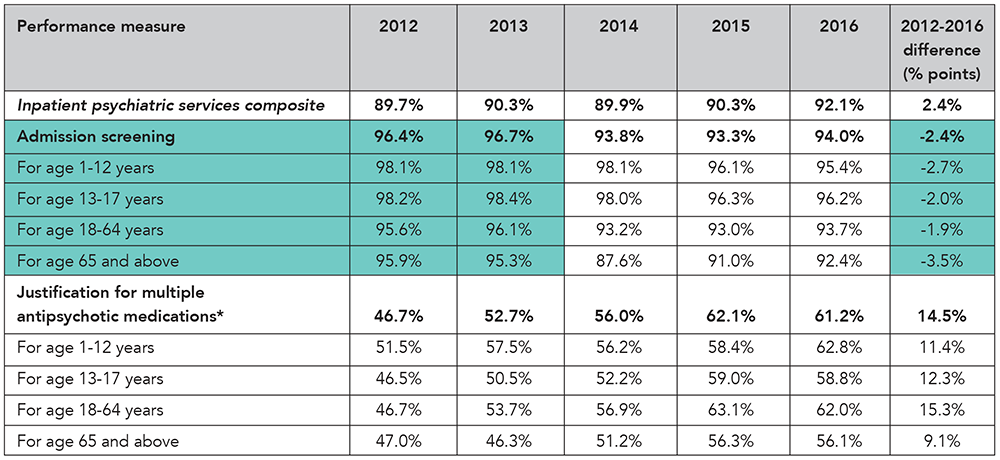
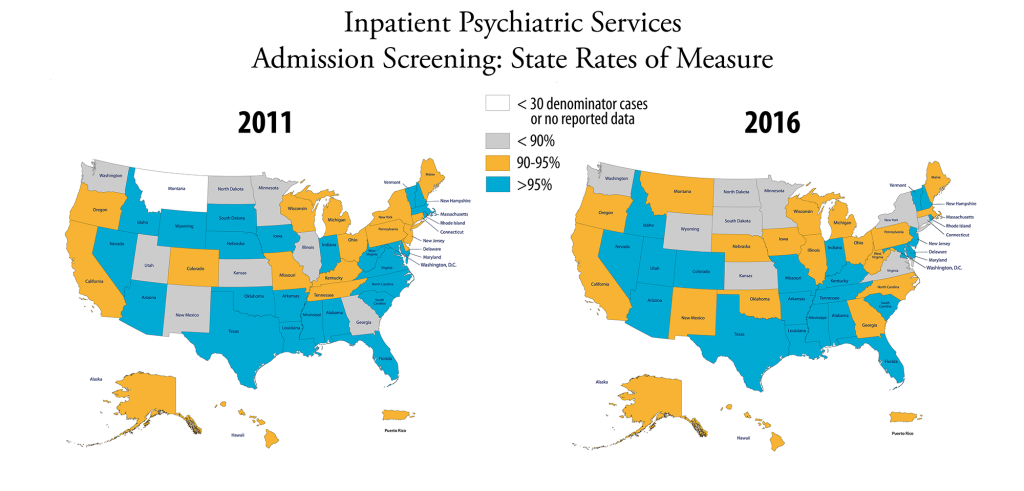
Admission screening. Evaluating a patient for violence risk, substance use, psychological trauma history and patient strengths within the first three days of admission to an inpatient psychiatric facility.
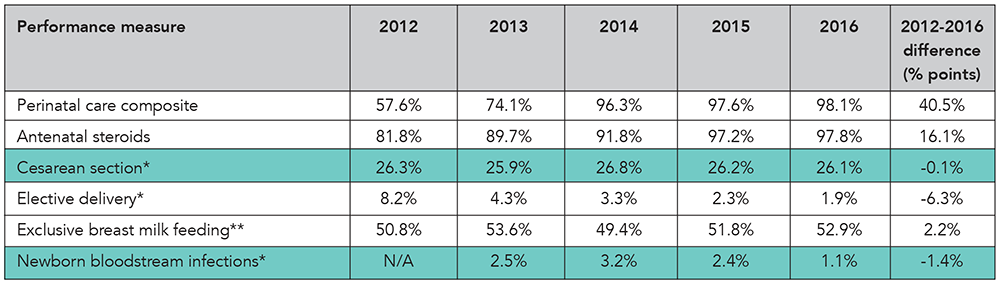
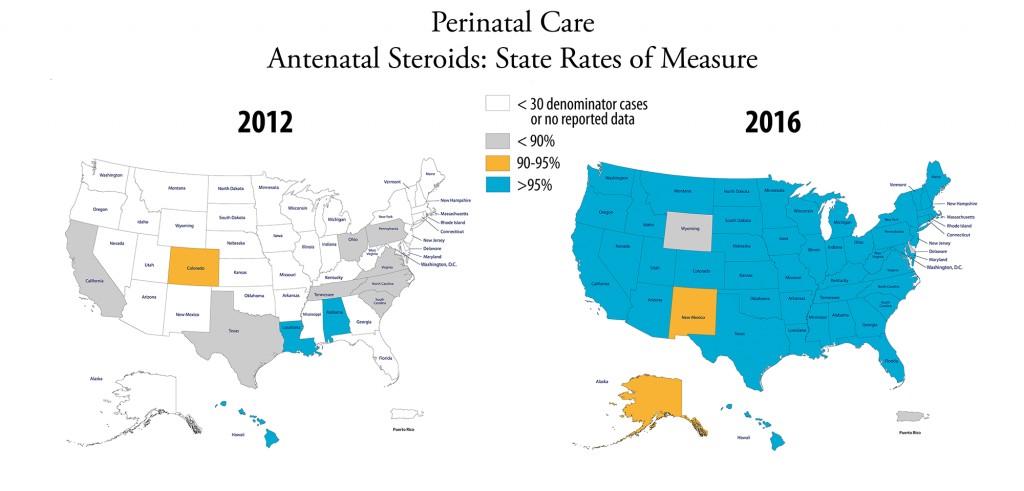
Antenatal steroids. Medication given to a mother in premature labor before delivery to promote lung development in the baby.
Antithrombotic therapy. Pharmacologic agents (oral or parenteral) that prevent or interfere with the formation of a blood clot.
Cesarean section. A surgical procedure in which an abdominal incision is made to deliver the infant.
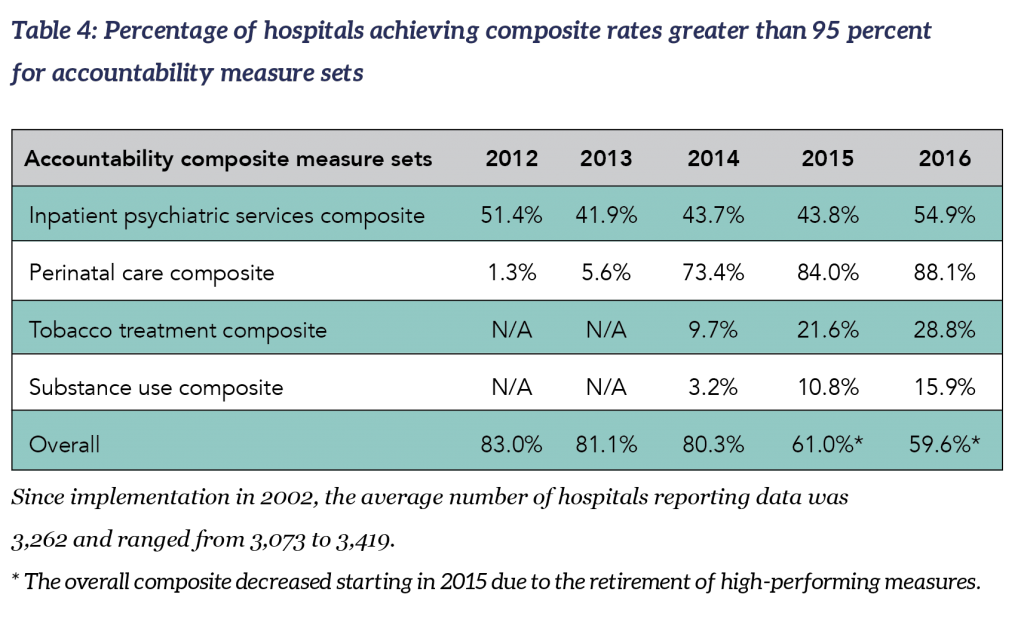
Composite measure. A measure that combines the results of two or more process measures into a single rating. A composite is a summary of a related set of measures, which could be a condition specific set, all accountability measures, or accountability and non-accountability measures. However, accountability composites are restricted to accountability measures; non-accountability measures are excluded.
Continuous variable measure. A type of measure in which the value of each measurement can fall anywhere along a continuous scale (e.g., the time [in minutes] from hospital arrival to administration of a medication).
Core measure. A core measure is a standardized quality measure with precisely defined specifications that can be uniformly embedded in different systems for data collection and reporting. A core measure must meet Joint Commission-established attributes, such as: targets improvement in population health, precisely defined and specified, reliable, valid, interpretable, useful in accreditation, under provider control, and public availability.
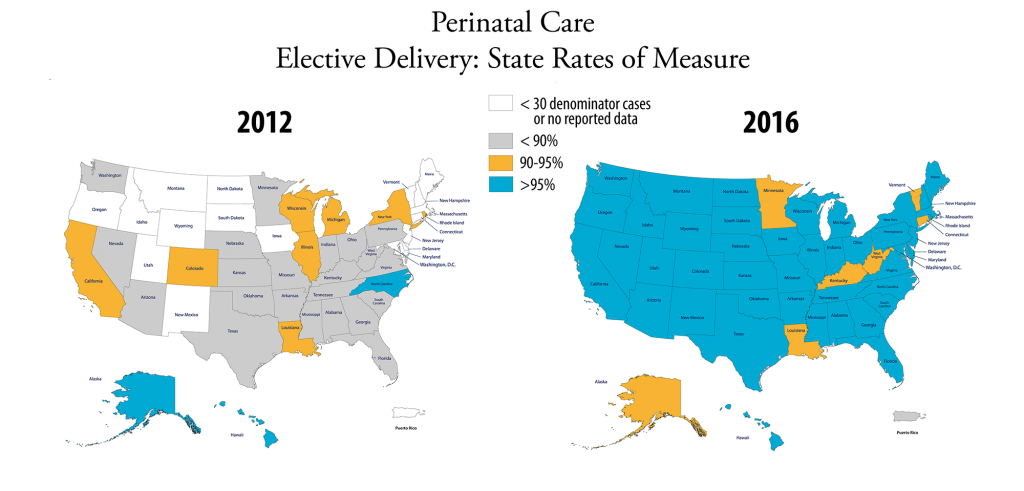
Elective delivery. A delivery occurring between 37 and 39 weeks of gestation, without a medical reason.
Electronic Clinical Quality Measure (eCQM). A clinical quality measure that is specified in a standard electronic format and is designed to use structured, encoded data present in the electronic health record.
Evidence-based care. Using current best evidence in making decisions about the care of individual patients or in the delivery of health services.
Exclusive breast milk feeding. An infant receives only breast milk during the hospital stay, with no additional food or drink, including water.
Fibrinolytic therapy. Medication that dissolves blood clots. Breaking up blood clots increases blood flow to the heart. If blood flow is returned to the heart muscle quickly during a heart attack, the risk of death is decreased.
Health care-associated infections in newborns. An infection acquired during a newborn’s stay in a hospital.
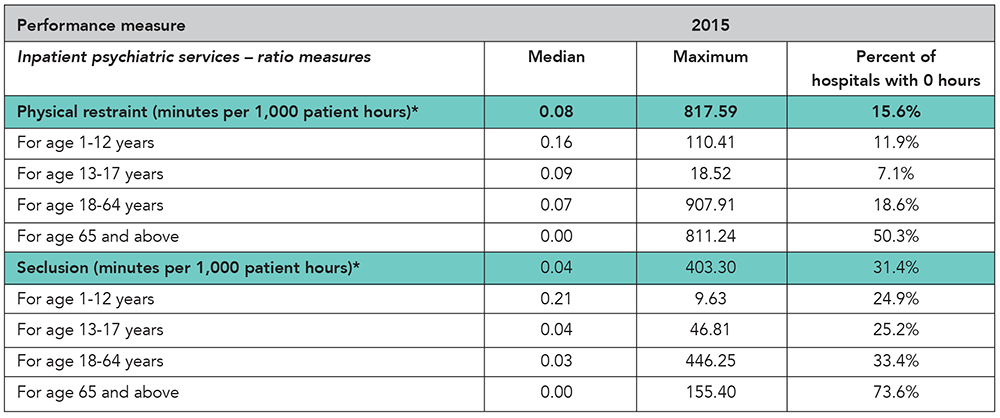
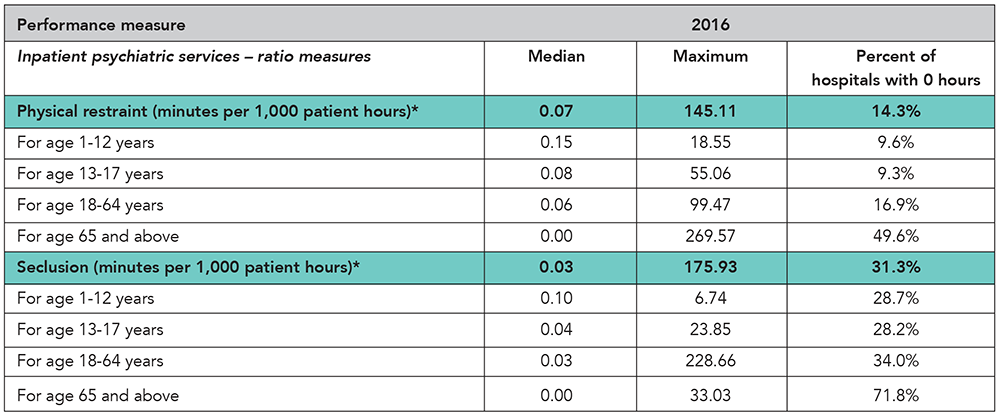
Inpatient psychiatric services. Inpatient psychiatric services include care provided to a patient for a mental disorder while hospitalized in a psychiatric unit of an acute care hospital or a free-standing psychiatric hospital. Services rendered to outpatients or “day treatment” patients are not considered inpatient psychiatric services.
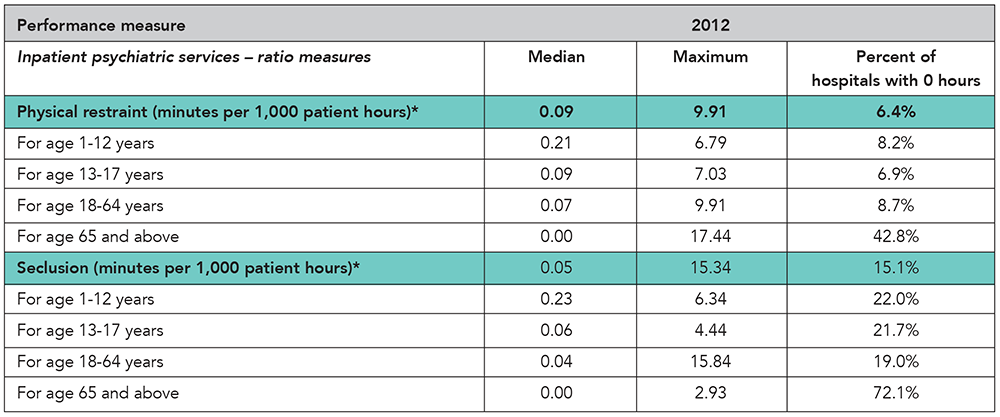
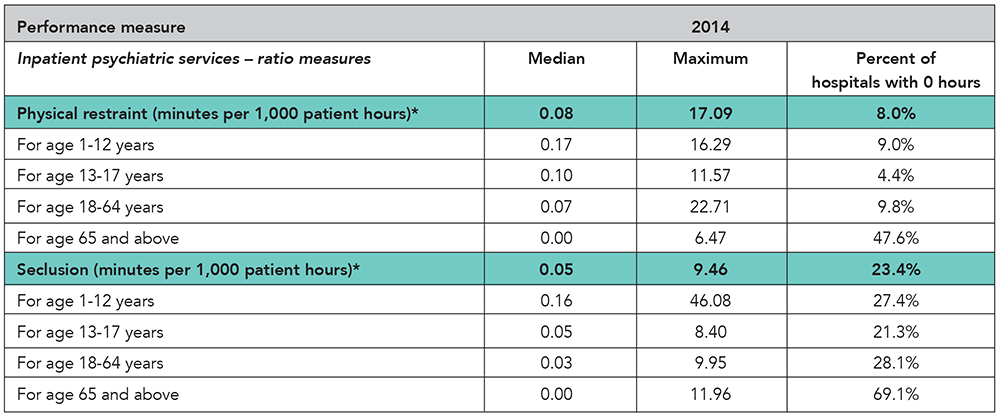
Median. The value in a set of observations whose values are arranged from smallest to largest that divides the data into two parts of equal size (e.g., if looking at the time [in minutes] from hospital arrival to administration of a medication and the ranked observations were 5, 10, 20, 30 and 40 minutes, the median would be 20 minutes).
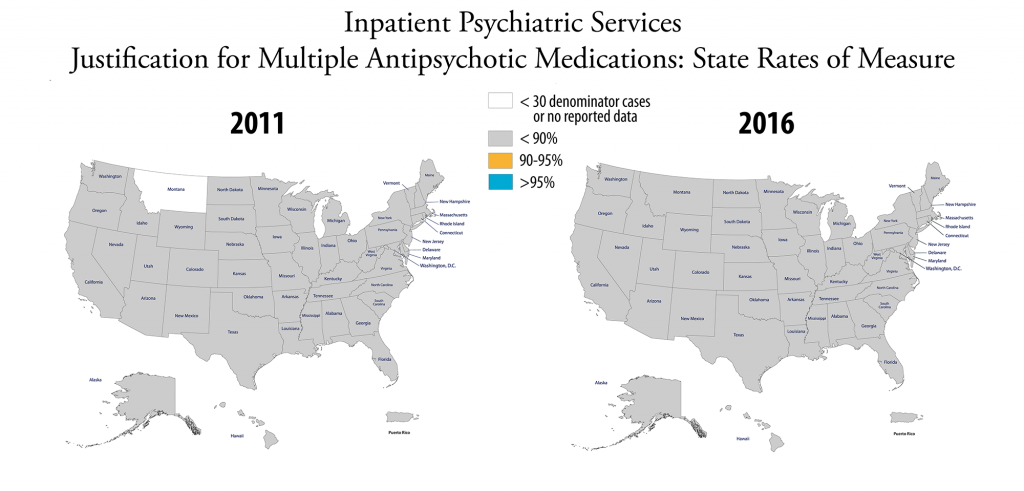
Multiple antipsychotic medications. Antipsychotic medications are drugs prescribed to treat mental disorders; if two or more medications are routinely administered or prescribed, it is considered multiple medications.
Outcomes measure. A measure that focuses on the results of the performance or nonperformance of a process. (See process measure.)
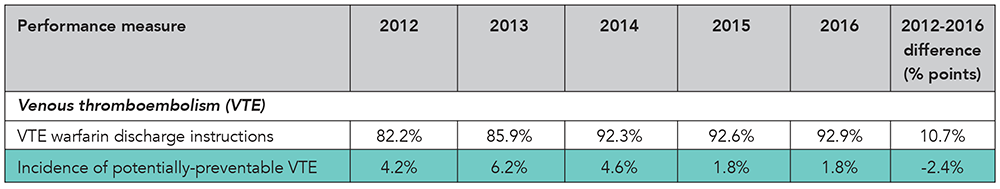
Overlap therapy. Administration of parenteral (intravenous or subcutaneous) anticoagulation therapy and warfarin to treat patients with VTE.
PCI therapy. PCI stands for “percutaneous coronary interventions.” PCI therapy is a coronary angioplasty procedure performed by a doctor who threads a small device into a clogged artery to open it, thereby improving blood flow to the heart. A lack of blood supply to the heart muscle can cause lasting heart damage. PCI therapy is used as an alternative treatment to coronary artery bypass graft surgery (CABG).
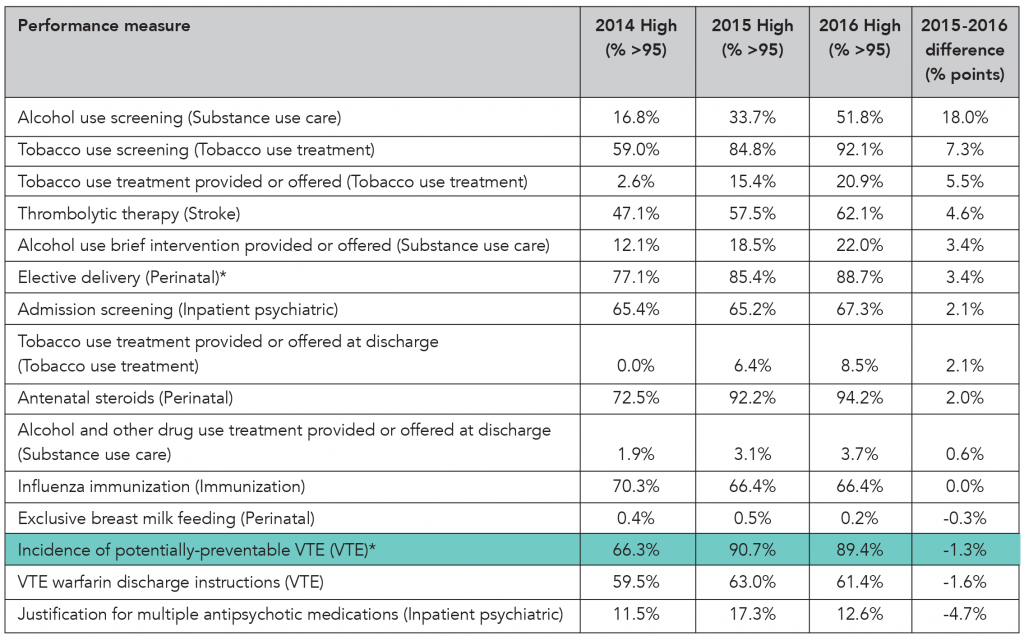
Percentage points. This is the difference on a percentage scale between two rates expressed as percentages. For example, the difference between a performance rate of 85 percent and a performance rate of 92 percent is 7 percentage points.
Perinatal. The period shortly before and after birth.
Perioperative. This generally refers to 24 hours before surgery and lasts until the patient leaves the recovery area.
Physical restraint. A physical restraint is any manual or physical or mechanical device, material, or equipment that immobilizes a patient or reduces the ability of a patient to move his or her arms, legs, body or head freely. A physical restraint is used as a restriction to manage a patient’s behavior or restrict the patient’s freedom of movement and is not a standard treatment for the patient’s medical or psychiatric condition.
Process measure. A measure that focuses on one or more steps that lead to a particular outcome. (See outcomes measure.)
Prophylaxis. Any medical intervention designed to preserve health and prevent disease.
Range. The smallest and largest values in a set of data (e.g., if looking at the time [in minutes] from hospital arrival to administration of a medication and the values from the ranked observations were 5, 10, 20, 30 and 40 minutes, the range would be 5,40 minutes). The range can also be defined as a single number, the difference between the smallest and largest values (e.g., 40 – 5 = 35 minutes in the example).
Rehabilitation assessment. Evaluation of the need for or receipt of rehabilitation services. Rehabilitation is a treatment or treatments designed to facilitate the process of recovery from injury, illness or disease to as normal a condition as possible.
Seclusion. Seclusion is the involuntary confinement of a patient alone in a room or an area where the patient is physically prevented from leaving.
Statin. A class of pharmaceutical agents that lower blood cholesterol. Specifically, the agents modify LDL-cholesterol by blocking the action of an enzyme in the liver which is needed to synthesize cholesterol, thereby decreasing the level of cholesterol in the blood. Statins are also called HMG-CoA reductase inhibitors.
Test measure. A measure being evaluated for reliability of the individual data elements or awaiting National Quality Forum endorsement.
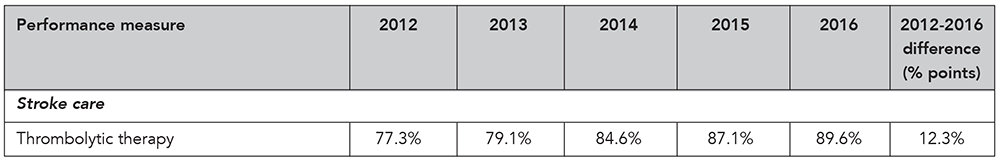
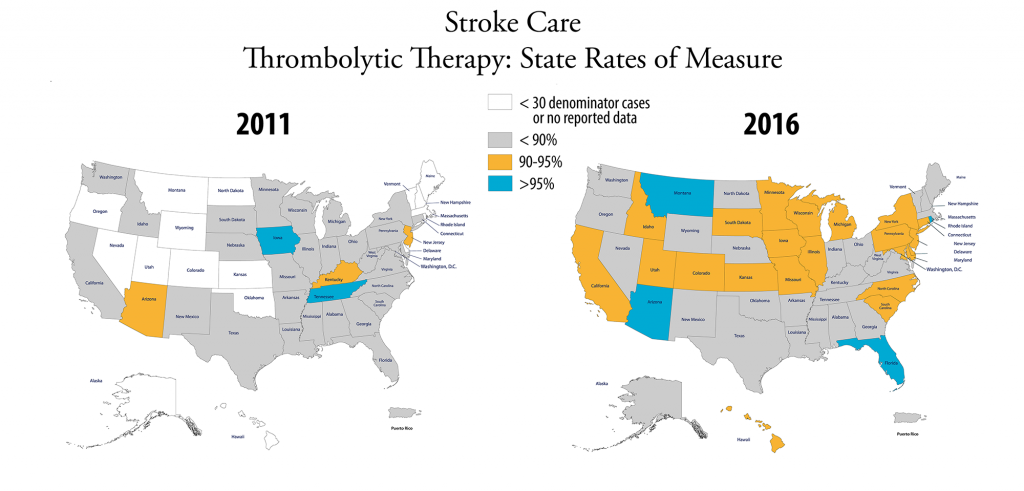
Thrombolytic therapy. Administration of a pharmacological agent intended to cause lysis of a thrombus (destruction or dissolution of a blood clot).
Top 10 percent. For measure reporting, this indicates the value (number) at which one-tenth of the recorded values are at this value or better (e.g., if looking at the time [in minutes] from hospital arrival to administration of a medication and the values from the ranked observations, a top 10 percent value of 151 would indicate that one-tenth of reporting hospitals have a measure value of 151 or less).
UFH monitoring. Using a protocol or nomogram to ensure that UFH (unfractionated heparin) achieves a sufficient level of anti-coagulation.
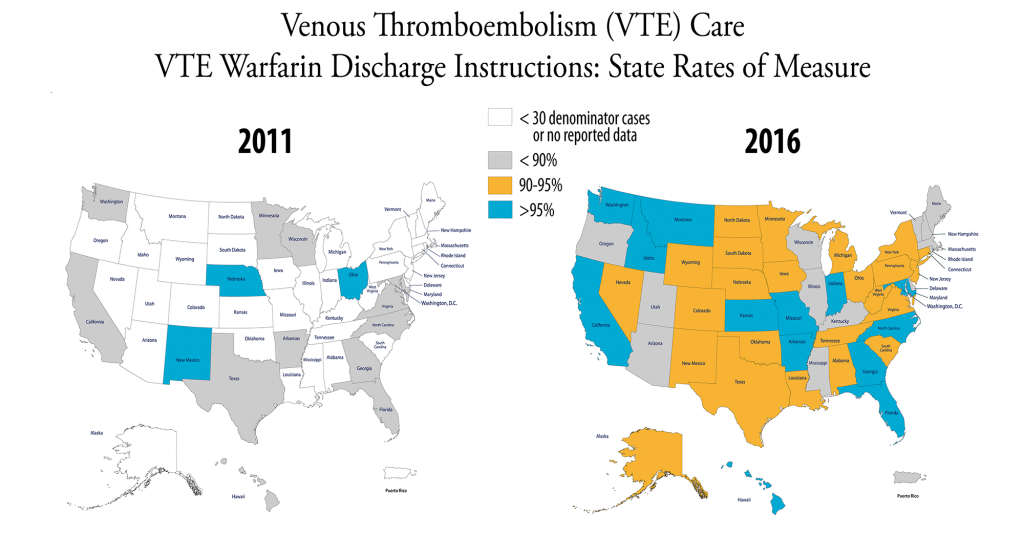
VTE. VTE stands for venous thromboembolism and is when a blood clot forms in a deep vein in the body, such as in the leg. VTE is a common complication at surgery, and hospitalized medical patients – particularly those who have decreased mobility – are at risk for development of VTE.


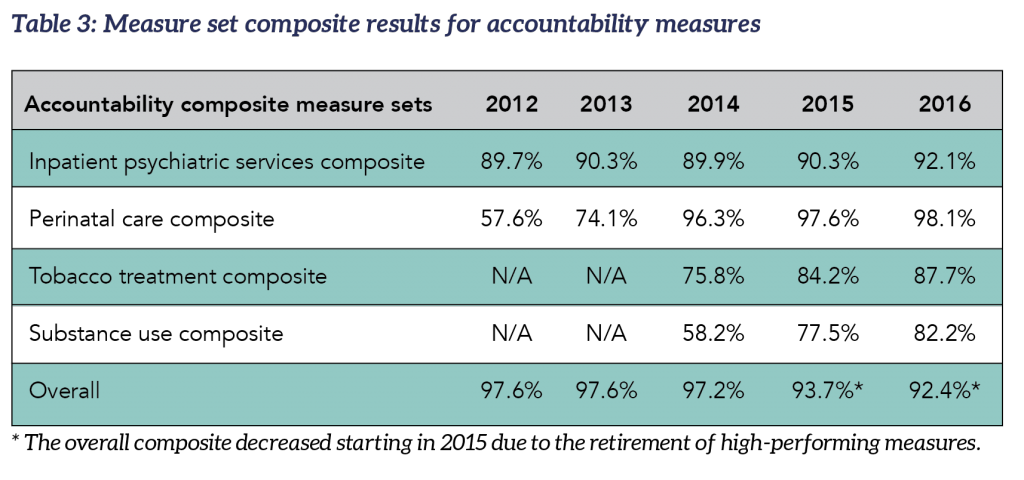
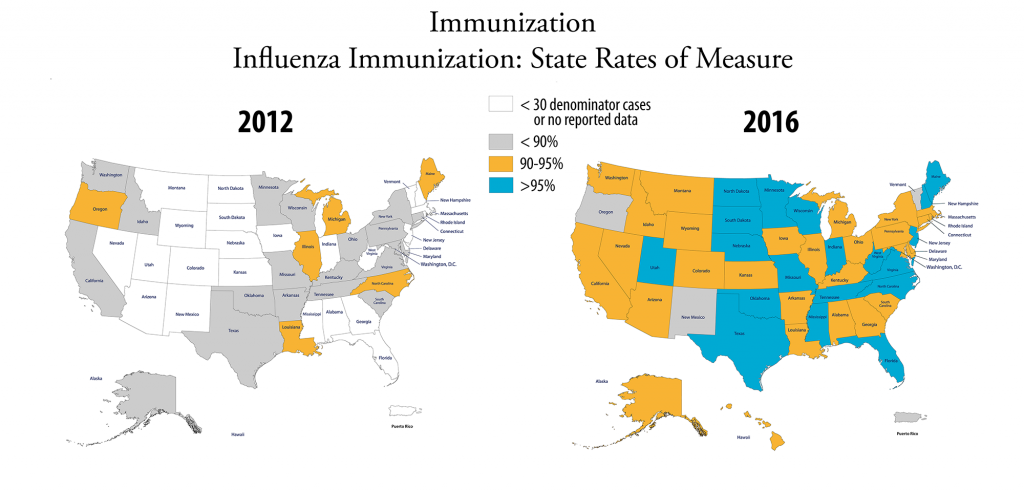
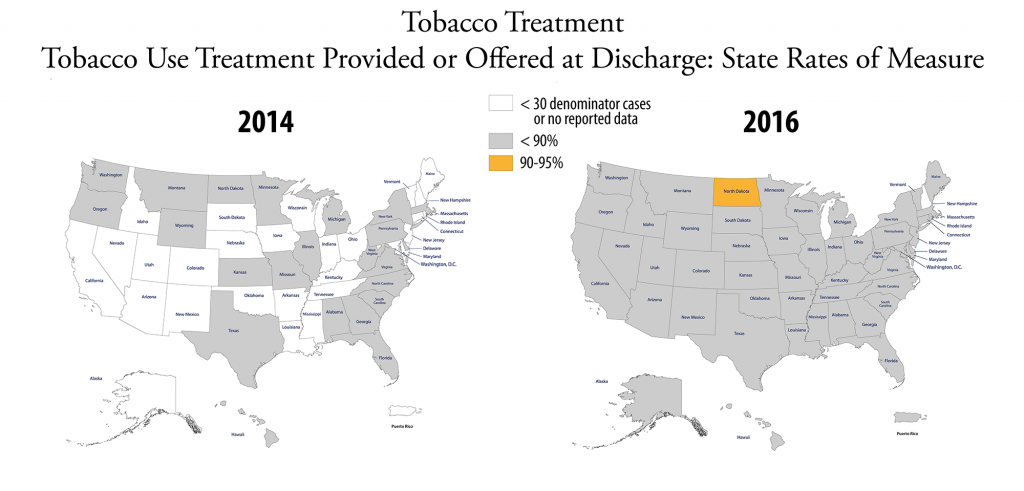
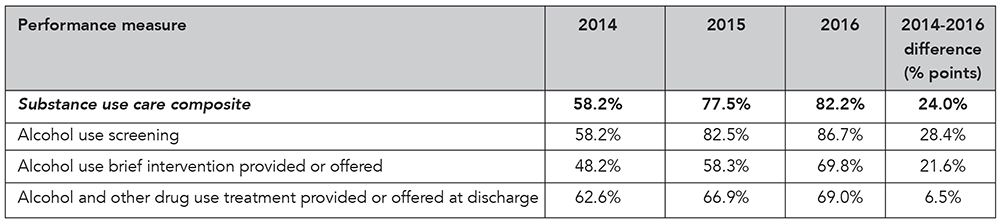
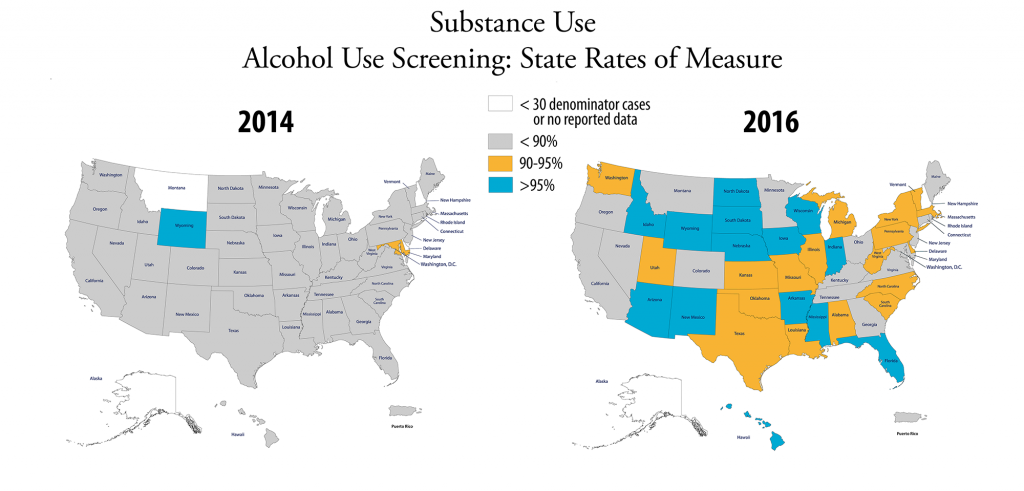
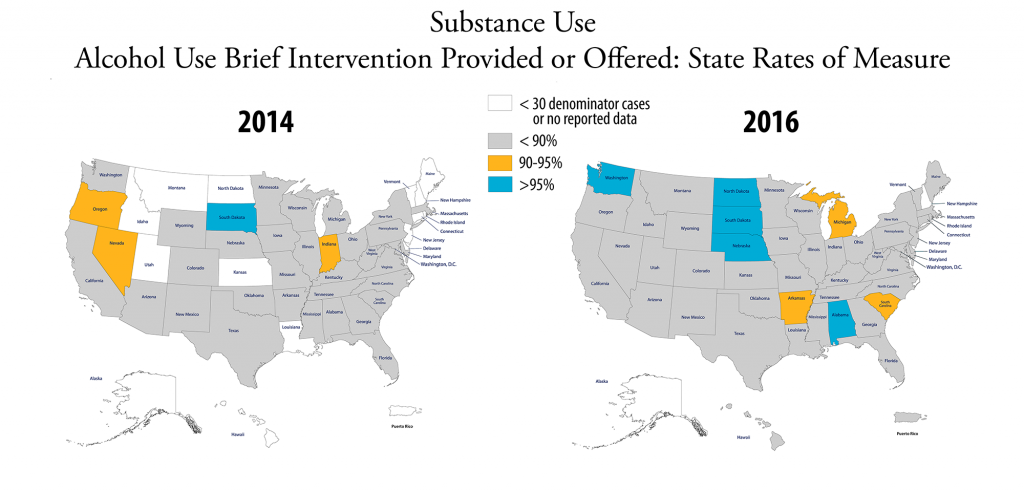
 Composite for accountability measures: The number of accountability measures used in the overall composite rates varies each year. The 2016 overall accountability composite calculation is derived from a total of 15 accountability measures from seven sets (inpatient psychiatric services, venous thromboembolism (VTE) care, stroke care, perinatal care, immunization, tobacco use treatment, and substance use care). Two rate measures from the inpatient psychiatric services set are not included in the overall accountability composite. There are no VTE, stroke or immunization measure set composites because a measure set composite must have at least two measures and these measure sets are comprised of only one accountability measure. The heart attack and children’s asthma care accountability measure sets included in last year’s report have been retired. For more information, see “
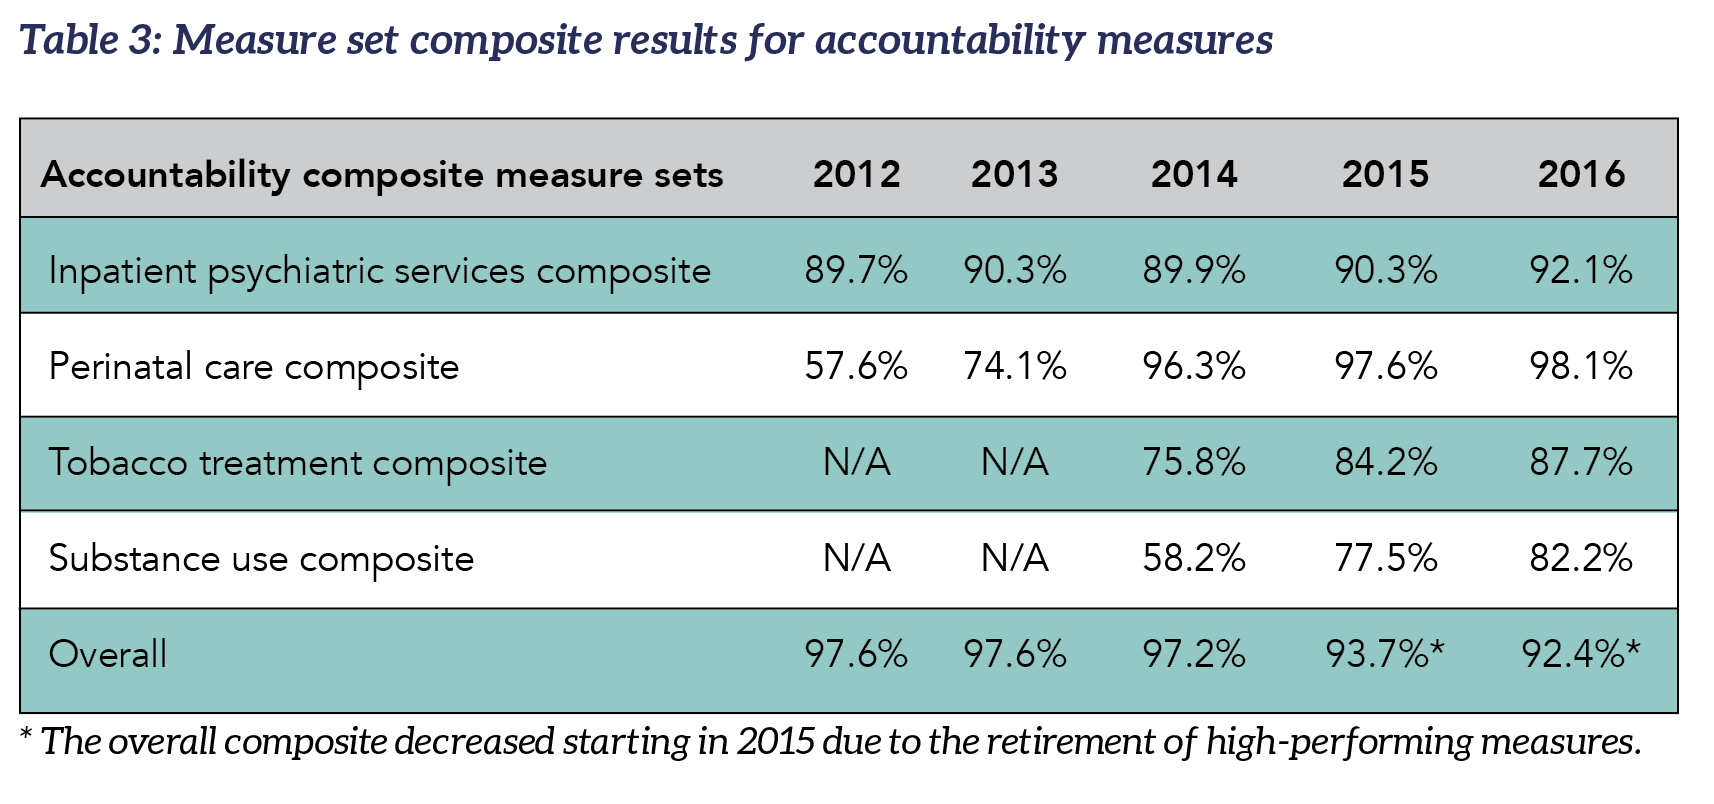
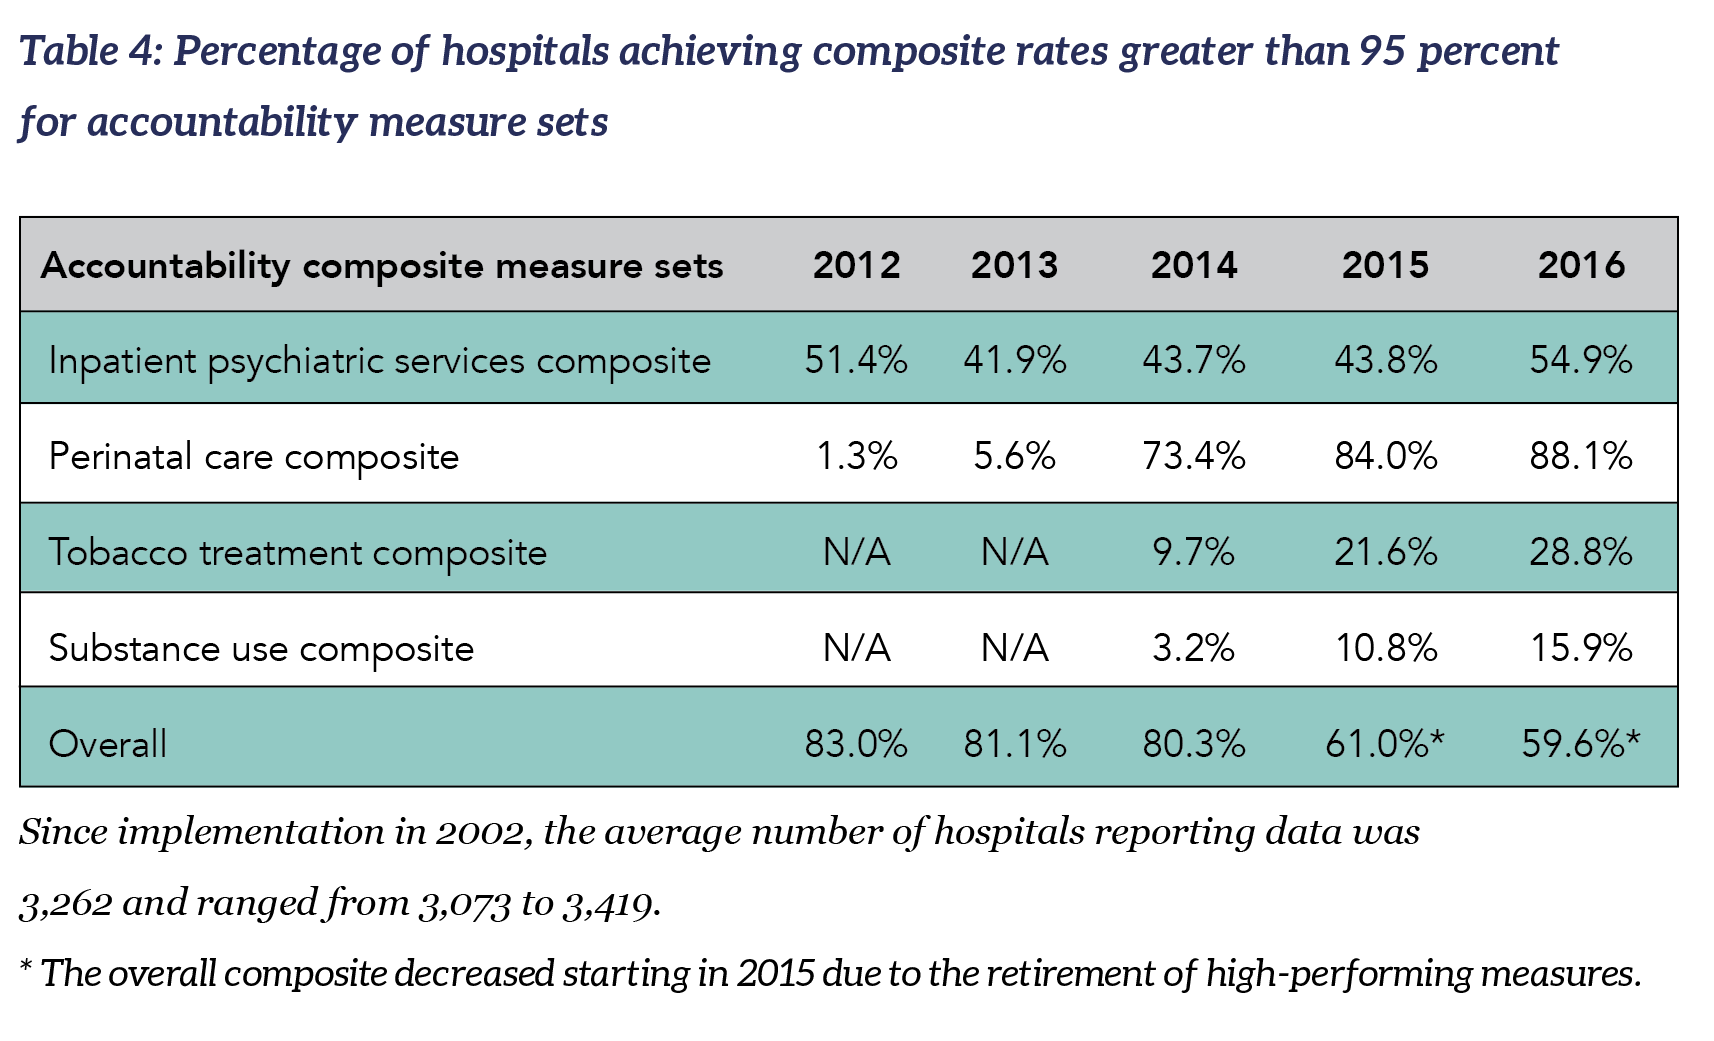


 The heart attack and children’s asthma care accountability measures included in last year’s report have been retired. There are no VTE, stroke or immunization measure set composites this year because a measure set composite must have at least two measures and these measure sets are comprised of only one accountability measure. Performance on the individual measures on these clinical topics showed good improvement.
 Key components of the Pioneers in Quality™ program include:
 The Joint Commission continues to be a leader in performance measurement. The data displayed on the CMS Hospital Compare website reflects many measures that The Joint Commission and CMS have in common. A large percentage of that data comes from The Joint Commission via its well-established performance measure data network. Today, this network comprises approximately 31 measurement systems, all under contract to The Joint Commission, and is the source of quality-related data on The Joint Commission’s Quality Check® website (
 2016 ORYX® performance measure reporting requirements
 Recent changes to The Joint Commission’s ORYX® performance measurement requirements are the result of the transition to eCQMs, as well as efforts to maintain close alignment with the Centers for Medicare & Medicaid Services (CMS) Hospital Inpatient Quality Reporting Program.
 During 2016, The Joint Commission conducted two voice of the customer surveys on eCQMs — one in the spring and another in the fall. The surveys found that awareness of reporting requirements is very high and for 2017 most hospitals plan to report eCQMs to CMS, as required.